
SOBHA L.L.C leads Dubai developers for unit and villa transactions, 2025-11-01 to 2026-04-30
A developer-level read on unit and villa transactions, with activity, value, and concentration across Dubai’s market corridors.

SOBHA L.L.C heads the developer ranking for Dubai unit and villa transactions across the six-month period, while the broader market remains concentrated in a handful of high-activity areas. Business Bay stands out on both transaction count and transaction value, reinforcing how area-level depth shapes the overall picture.
Market Snapshot
Nov 1, 2025 - Apr 30, 2026
Total value
AED 20B
Top area by transaction value: Business Bay
Transactions
5,989
Top area by transactions: Business Bay
SOBHA L.L.C heads the developer ranking for Dubai unit and villa transactions across the six-month period, while the broader market remains concentrated in a handful of high-activity areas. Business Bay stands out on both transaction count and transaction value, reinforcing how area-level depth shapes the overall picture.
Key Findings
Top developers by transactions
- SOBHA L.L.C leads the developer ranking for Dubai unit and villa transactions in the selected period.
- Business Bay records 5,989 transactions and AED 20,035,482,942 in transaction value.
- The monthly trend and property-type visuals are essential for separating timing, mix, and developer concentration.
- Sobha Central appears in the comparator project set, adding project-level context to the developer-led frame.
Developer leaderboard and activity mix
SOBHA L.L.C sits at the top of the developer table for unit and villa transactions in this period, which makes the name a useful anchor for reading the rest of the market structure. The accompanying visuals on developer value and transaction count are important because they separate capital concentration from raw deal flow, rather than treating the two as interchangeable.
Project activity around the leading developer
The project-level frame adds context to the leaderboard without changing it. Sobha Central appears among the more active projects in the comparator set, and the concentration of project activity around a limited number of assets helps explain why developer output can look heavy even when activity is uneven across the wider market. The count-versus-value view is especially relevant here because it shows whether a developer’s footprint is broad, concentrated, or tilted toward larger-value registrations.
Transaction count vs value by developer
Area footprint and monthly pattern
Business Bay is the clearest area reference point in this slice, leading both transaction count and transaction value. The monthly trend visual and the property-type distribution visual provide the broader backdrop: they show how unit and villa transactions are distributed across time and product mix, which matters when assessing whether developer activity is flowing through a narrow set of months or a wider run of registrations.
Monthly transaction trend
Methodology and caveats
This article is framed around DLD-classified unit and villa transactions over 2025-11-01 to 2026-04-30. The final month in the series may be partial, so the monthly trend should be read as a near-term register rather than a full completed month, and the ranking visuals should be interpreted alongside the product-mix chart to keep the developer comparison grounded in scope.
Evidence Highlights
- Top area by transactions: Business Bay (5,989)
- Top area by transaction value: Business Bay (AED 20,035,482,942)
Sources & methodology
How this report was built
This is an editorial analysis. It sets out our reading of the market rather than a computed dataset.
Data coverage
Any figures mentioned are attributed in the text to the source they came from.
Reporting window
Nov 2025 → Apr 2026
Article scope
Units + Villas
Related stories

May 2025 – April 2026
Business Bay vs Palm Jumeirah: Dubai’s two-area value race
Dubai’s unit and villa transactions over the 12-month period were led by a clear two-area frame: Business Bay at the top of both transaction count and transaction value, with Palm Jumeirah in second place on each measure. The comparison is useful because it pairs activity volume with value concentration, while the wider charts show how that pattern sits alongside developer concentration, monthly shifts, and the property-type mix.

May 2025 – April 2026
Business Bay leads both count and value in Dubai units and villas
Dubai's unit and villa market is anchored by a clear area concentration: Business Bay leads both activity and value, with Palm Jumeirah following on each leaderboard. The monthly transaction trend, top developer mix, and property-type split add context to how that concentration sits within the wider market structure.

Dubai Residential Prices Fall 1.7% in August 2026 as Sales Value Reaches Approximately AED 23.4 Billion
Dubai’s average residential sales price fell 1.7% year-on-year in August 2026 to approximately AED 1,636 per square foot, while residential transactions reached approximately AED 23.4 billion for the month.
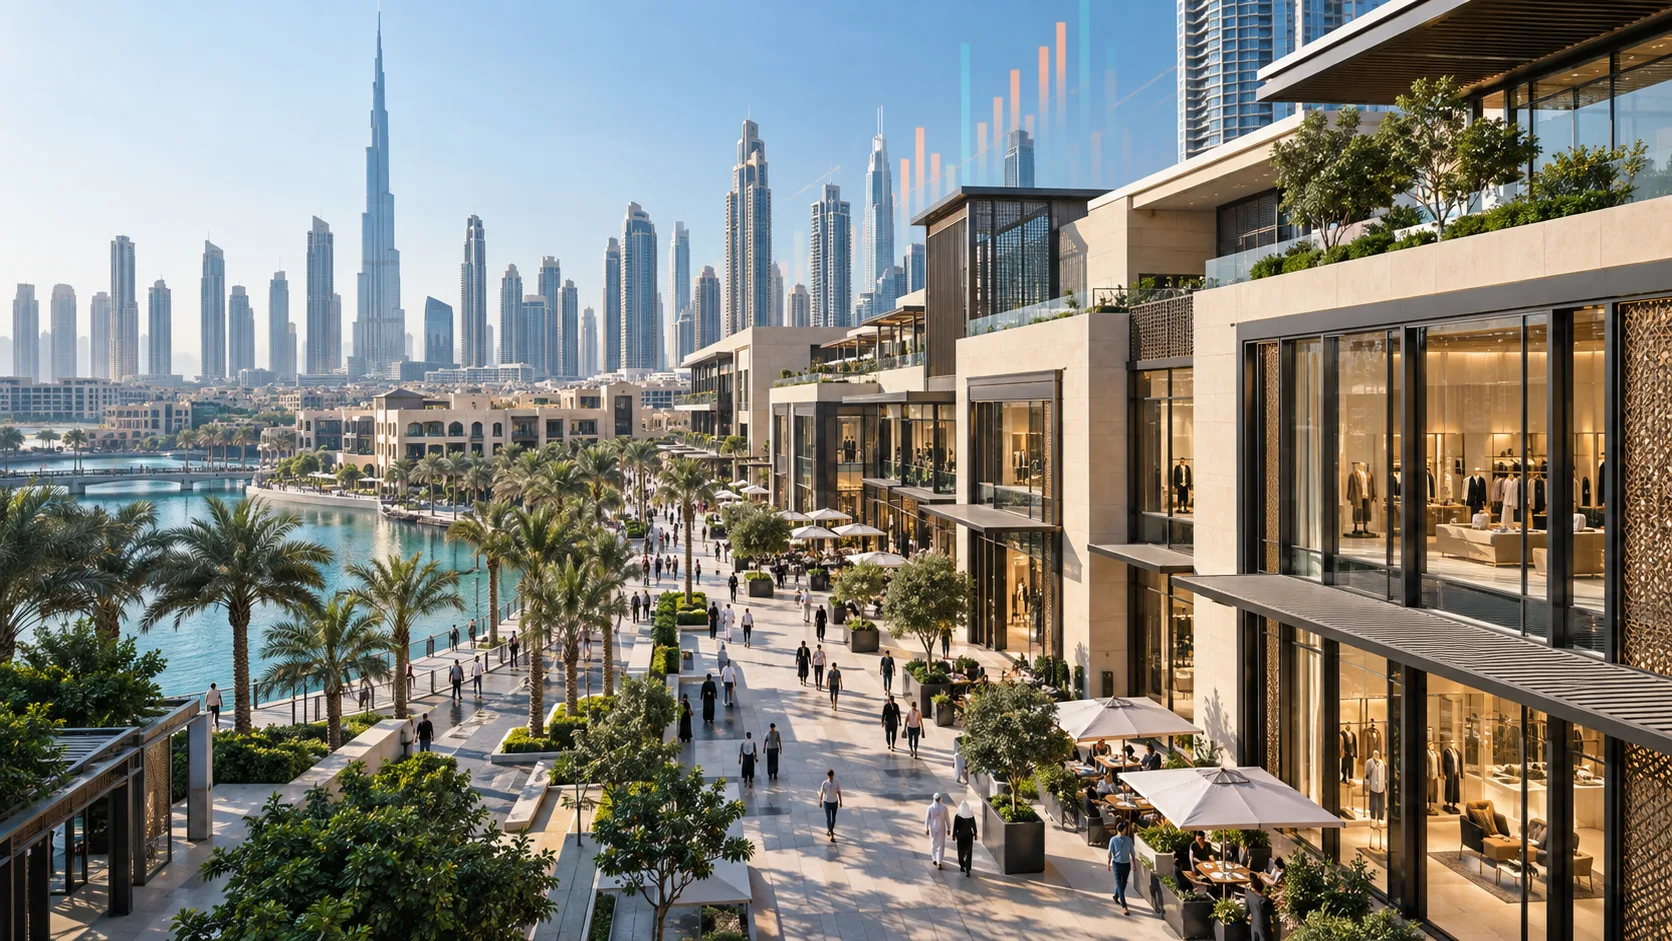
Dubai Retail Rents Rise 5.9% to AED 252 per Square Foot in H1 2026
Dubai retail property rents increased 5.9% year on year during the first half of 2026, moving from AED 238 to AED 252 per square foot. The performance reinforces the importance of location, leasing quality and tenant retention for owners and investors assessing the emirate’s retail assets.