

Dubai’s unit and villa activity stayed concentrated in a narrow set of areas in H1 2026
Madinat Al Mataar led the period on transaction count, while the top-areas chart shows a tightly packed field behind it across unit and villa transactions.
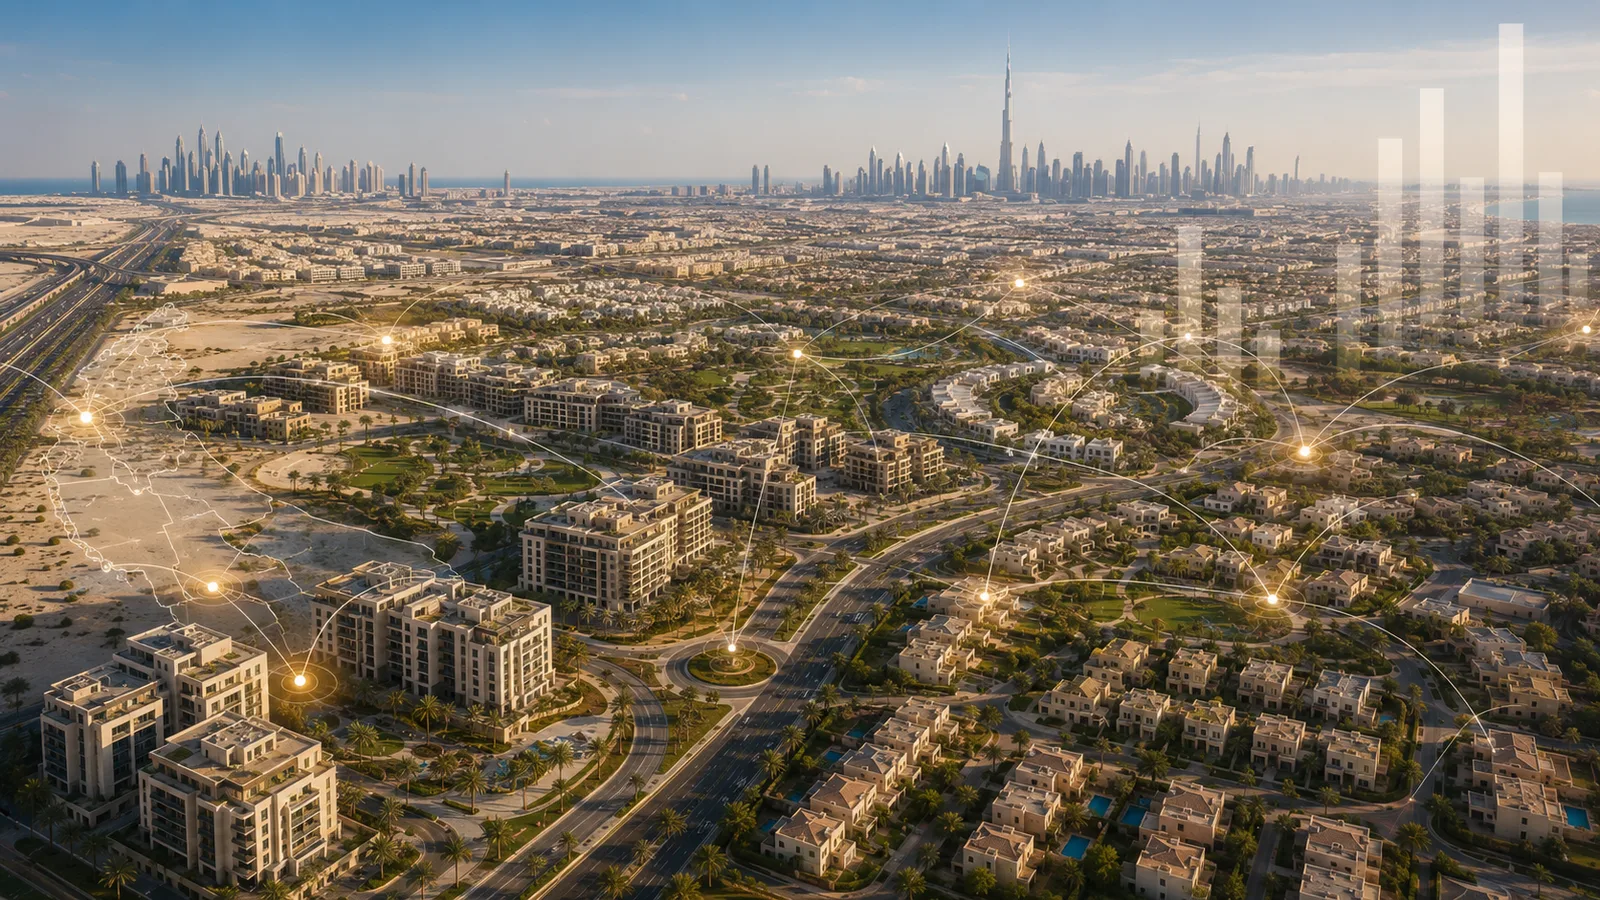
Dubai’s unit and villa transactions in the first half of 2026 were concentrated in a small group of areas, with Madinat Al Mataar setting the pace on deal count and a cluster of other districts close behind. The monthly pattern also shows a strong start to the year, a softer May, and a partial June reading that should be read as month-to-date activity through 30 June.
Market Snapshot
Jan 1, 2026 - Jun 30, 2026
Total value
AED 12.1B
Based on DLD-backed transaction analytics for the selected period.
Transactions
7,045
Based on DLD-backed transaction analytics for the selected period.
Transactions
4,849
Based on DLD-backed transaction analytics for the selected period.
Transactions
5,201
Based on DLD-backed transaction analytics for the selected period.
Dubai’s unit and villa market in the first half of 2026 was led by a relatively small cluster of high-activity areas, with Madinat Al Mataar topping transaction count and several other districts close behind. The monthly pattern was front-loaded, with a strong start to the year, a softer May, and a June figure that reflects activity through 30 June rather than a full-month close.
Key Findings
- Madinat Al Mataar transaction count: 8,765
- Madinat Al Mataar total value: AED 12.06B
- Al Barsha South Fourth transaction count: 7,045
- Al Barsha South Fourth total value: AED 8.19B
Madinat Al Mataar led the six-month transaction count
Madinat Al Mataar recorded 8,765 unit and villa transactions worth AED 12.06B, making it the most active area in the period by deal count. Al Barsha South Fourth followed with 7,045 transactions, while Wadi Al Safa 5 posted 5,201, underscoring that activity was spread across several high-volume districts rather than concentrated in one location. The top-areas chart shows how closely grouped the leading areas are on transaction count, even as transaction values vary materially from one area to the next.
Value and count did not move in lockstep across the leading areas
Business Bay illustrates the gap between transaction count and transaction value: it ranked fourth by count with 4,849 transactions, but its value reached AED 18.6B, above several areas with higher deal volumes. Al Yelayiss 1 and Marsa Dubai also recorded transaction values above AED 11.0B, while their transaction counts were lower than the highest-volume areas in the set. That divergence matters because it shows the leading areas are not defined by volume alone; value adds another dimension to how activity is distributed across Dubai.
The monthly profile started strong before easing in late spring
Monthly unit and villa transactions were highest in February at 19,270, narrowly ahead of January’s 19,129. Activity then eased to 15,580 in March, recovered to 16,488 in April, and fell to 12,540 in May before rising to 16,281 in June through 30 June. On value, the pattern was similar: AED 52.5B in February, AED 38.0B in March, AED 42.4B in April, AED 27.8B in May, and AED 31.9B in June through month-end. June should be read as a partial month, so the latest reading is best treated as in-period activity rather than a final full-month result.
Methodology and scope
This article covers Dubai unit and villa transactions over 1 January to 30 June 2026 and uses the top-areas-by-transaction-count visual as the hero chart. The rankings and values cited here are limited to the areas and months shown in the provided evidence, and the June monthly reading is a month-to-date figure through 30 June.
Data notes
- Transactions recorded: 8,765
- Total transaction value: AED 12.06B
- Transactions recorded: 7,045
- Transactions recorded: 5,201
- Transactions recorded: 4,849
- Total transaction value: AED 18.64B
Sources & methodology
How this report was built
This is an editorial analysis. It sets out our reading of the market rather than a computed dataset.
Data coverage
Any figures mentioned are attributed in the text to the source they came from.
Reporting window
Jan 2026 → Jun 2026
Article scope
Units + Villas
Related stories
May–July 2026
Al Thanyah Fifth: 19 listed projects, prices from AED 1.8m and 1,512 recorded transactions
Helps a buyer or agent judge what is actually available in Al Thanyah Fifth and at what recorded price level.

June 2026
ELTIERA VIEWS vs AZIZI VENICE 14: value concentration meets transaction breadth in June 2026
June’s project table puts ELTIERA VIEWS and AZIZI VENICE 14 side by side on transaction value, with ELTIERA VIEWS recording AED 698.6M across 254 unit and villa transactions and AZIZI VENICE 14 posting AED 557.7M across 731. The comparison is useful because the two projects show very different count-and-value profiles, while the remaining metrics in this slice are not part of the project comparison.

June 2026
AZIZI Developments leads Dubai developers by transaction value in June 2026
AZIZI Developments recorded the highest transaction value among Dubai developers in June 2026, supported by 3,775 unit and villa transactions worth AED 3.24B. The ranking visual also points to a pronounced spread between value and count across the leading developers, with AZIZI combining the largest total value in the table and a mid-range median value of AED 670,000.
June 2026
Madinat Al Mataar leads Dubai areas by transaction value in June 2026
Madinat Al Mataar was the largest Dubai area by transaction value in June 2026, recording AED 3.11B across 2,924 unit and villa transactions. The top-areas-by-value view also shows a notable gap to the next-ranked areas on value, with the broader monthly slice carrying a cautious tone because the reporting set is not stable.